Okay, you’ve done the hard part. Formulating a problem, acquiring , cleaning, and labeling data, building a naive baseline model, then beating that model. You now have an accurate model that you’re proud of, but is still mostly useless to your user. You need to build a prototype to show your work and eventually deploy. Sharing a GitHub repo or script isn’t going to cut it. Here are a few options from lowest to greatest fidelity.
Option 1: Jupyter Notebook
Delivering a jupyter notebook to the end user is the fastest and easiest way to provide a data science tool. If you are trying to build an interactive data science tool for your end user (for instance to make predictions off of new data), this may be a good option for an initial prototype. There are many tricks you can use to minimize code-user interactions and make it more polished. A combination of ipywidgets and html code in your notebook can hide non-user friendly code and only display the buttonology needed to navigate the workflow. If users are running the notebook from local machines, you should create a package’s requirements file to ensure environments are loaded correctly.
While a jupyter notebook can be a useful initial prototype display, regardless of how many set up and running instructions you create, it still requires the user to have all software and dependencies installed and be comfortable navigating jupyter. Furthermore, it runs the risk of file corruption and can not be easily integrated into complex workflows. Depending on network restrictions, you could hypothetically also use pyinstaller to create an executable file that wraps up all required packages. However, this generally runs into approval difficulty with network managers. As a result, when a problem requires a quick solution or you have limitations in access to servers or cloud environments, a jupyter notebook can be a reliable solution.
Here’s a tutorial on making jupyter notebooks interactive and another for ipywidget.
Option 2: Web Dashboard
Many data scientists aren’t good at building applications. If your user is interested in visualizations or wants limited interaction with your model (e.g., provide intput data, parameters), you could build a web dashboard. The two main python-based frameworks for building web dashboards are Streamlit and Plotly-Dash. Note that both can be extended for more complex web applications as well.
#### Streamlit + Heroku
Streamlit helps translate Python scripts into easy-to-render visuals or webpages with little overhead. And you can deploy straight from your GitHub repo! Streamlit is a PyPI library that allows you to use .py scripts to write to a streamlit application. It’s great for visualization and allows for interaction using sliders, text-entry, file upload, and more.
Here are some Streamlit demos. We’ve also shared screen-grabs of NYC Uber Rideshare Pickup Data, computer vision for chest x-ray analysis, and a NFL Wide Receiver Dashboard.
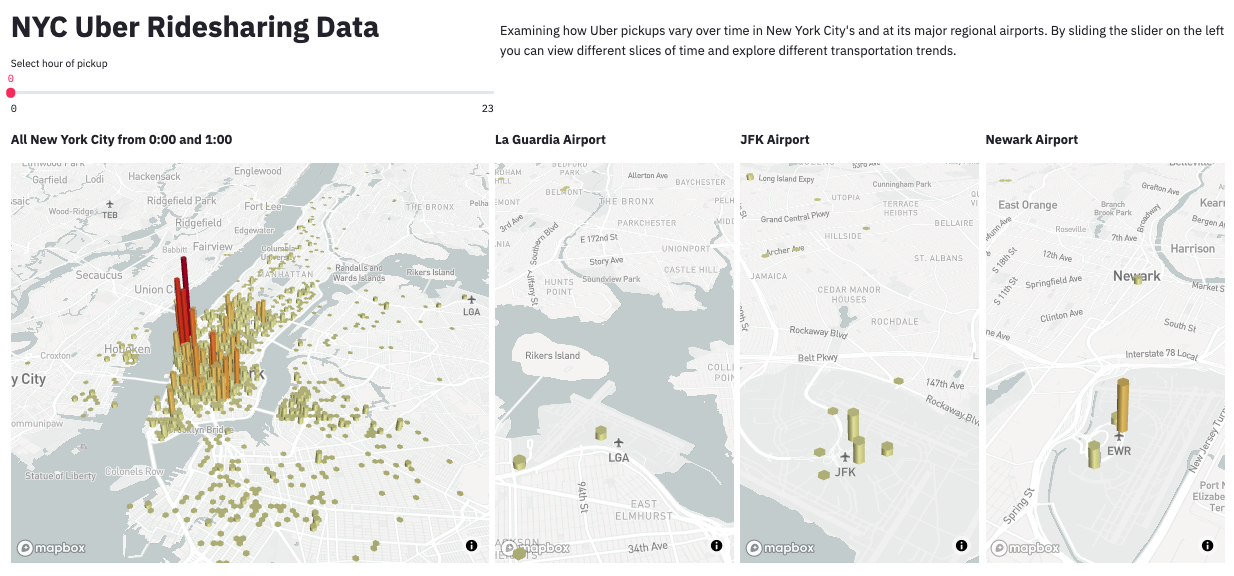
NYC Uber Ridesharing Data. Source
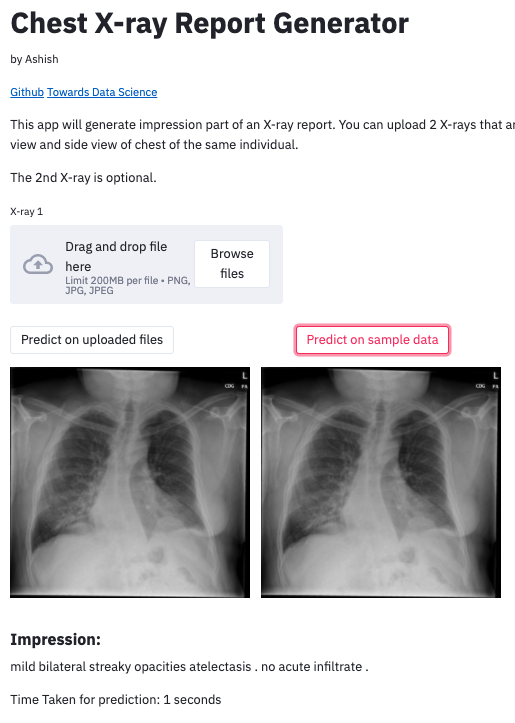
Chest X-Ray Report Generator. Source
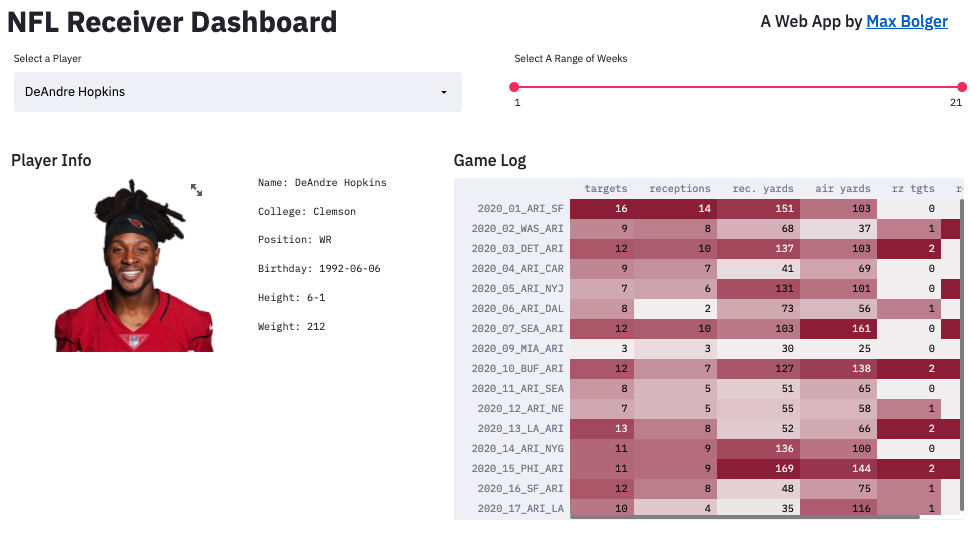
NFL Wide Receiver Dashboard. Source
Here’s a TDS guide to building a Streamlit app, the very helpful Streamlit documentation, getting started tutorial, API. If you’re not comfortable using the documentation, Coursera offers a guided course on creating a data science app with Streamlit.
When you’re ready to deploy your app from your local machine to the web, you can check out their deployment instructions. This allows streamlit to use your public GitHub repo for deployment. Other options (AWS, Google Cloud, Heroku, as a standalone executable) are also available with community-created guidelines here.
#### Plotly-Dash
Similar to Streamlit, Plotly-Dash is a leading python (or R) based framework for building web dashboards and apps. In comparison, Plotly-Dash focuses on production/enterprise settings whereas Streamlit is focused on rapid prototyping. For more details on the difference between the two, check out this TDS article. To see some Plotly-Dash demos, check out their app gallery. For implementation, see their official tutorial or this blog post.
Option 3: A Web App
A web application, or a mobile application, could be what a customer actually envisions when they ask you to solve their Machine Learning / Data Science problem. While this may not be attractive to most organizations that are less involved with web and mobile app developers, it may be the only choice for a customer that prefers an easy, accessible solution. In this case, opt for easy front-end libraries that can connect to a nice, formatted API model. This requires a bigger team – people that can take the output of a ML model, format it to a JSON (or other data structures that can be easily transferred and then visualized), and someone to then “beautify” the front-end. Not an easy endeavor for the casual data group, but if it can be afforded, you will reap dividends. Note that solid managers will be extremely important.
To do this, you’ll need to:
- Save your model
- Deploy as an API
- Another article here
- Connect API to front-end
- Containerize
Option 4: Software, Programs, and Executables
This is one of the longest living and most common methods for deploying computer-based tools in the DoD. However, it is not the recommended solution. The pros of using this are that the end user can just click the program and run your data science tool on their local machine without knowledge of programming, development environment access, or network connections.
However the cons are that it is rarely lightweight and will likely be memory intensive on local machines. In addition, it requires a lot more user interface development and software development skills. Version control and maintenance will also be more difficult. More importantly, your cyber security manager might have a hernia when they find random executables and programs on their computers (more likely it will just be blocked from running). If you have the leeway to create and run programs on local machines and are not concerned with memory costs on local machines, this is the way to go.
To create an executable in Python you can use Pyinstaller. It turns your scripts into an application by wrapping up all the dependencies into something shareable across machines.
Continuous improvement
You likely won’t be able to deploy your model and walk away. Your model and your deployment pipeline should be maintained and improved.
To avoid degrading model performance due to dataset shift (discussed in Recipe 9), you should incorporate a real-data feedback loop in your pipeline. User environments will almost always change with time so make sure your model and/or data accounts for that. Seek out real-world failure points, continuosly update your dataset with these real world examples, retrain your model, and re-deploy. Check out this example of how Amazon AI’s data flywheel continuously improves Alexa. For more in-depth information about continual learning and automating the ML pipeline, check out the “Continual Learning in Practice” paper from Amazon.
For more practical details about model deployment, check out our short-term, medium-term, and long-term solutions in Recipe 2.
Navigation
» Previous recipe
» Appendix
» About
» Ingredients
» All recipes
» Resources
» Code examples